In an age where every impression counts and audiences are spread across screens, understanding your competitors’ TV strategy is more valuable than ever. From brand awareness campaigns on national networks to hyper-targeted CTV buys, analyzing how brands deploy their video ad budgets can reveal the playbook behind their growth.
For media planners, buyers, and analysts, reverse engineering a competitor’s TV strategy can:
- Surface whitespace opportunities
- Uncover audience targeting tactics
- Reveal flighting and creative rotation decisions
This guide walks through the key data points and what they reveal, starting from a high-level view and going granular, to help you uncover actionable intel that can sharpen your own strategy.
1. Define Your Competitive Set
Before diving into the data, choose a set of brands to benchmark against. These can include:
- Direct competitors in your category
- Aspirational brands with sophisticated media strategies
- Disruptors or challengers trying new approaches
Why it matters: Selecting the right set ensures your analysis is strategic, not scattered. You’ll better identify where you should compete and where you can stand out.
2. Map Pacing and Daily Impressions Over Time
Start by plotting daily or weekly impressions over time which can immediately surface key insights about a brand’s campaign pacing strategy. This can show:
- Always-on buys (consistent presence year-round)
- Flighted campaigns tied to holidays or promos
- Blackout periods before new campaign launches
What to Look For:
- Is the brand “always on” or spiking around key dates?
- Are there clear dips that suggest seasonality or budget pullbacks?
- Can you match spikes to product launches or promotions?
Why it matters: Understanding when brands go live (or dark) helps you anticipate competitive pressure and time your campaigns more effectively.

Pro Tip: Sudden drop-offs might signal creative fatigue, performance issues, or a pivot in marketing strategy.
3. Break Down Impressions by Market
Analyze which media markets are getting the most activity per brand to help uncover geo-targeting strategies:
- Even foot print = national reach
- Select markets = regional or local presence
- Large but sparse footprint = potential cable/satellite/OEM distribution
What to Look For:
- Are they investing everywhere or only in key conversion markets?
- Are specific cities or regions prioritized?
Why it matters: Media market analysis reveals how broadly or precisely a brand is applying pressure, which can point to test strategies, franchise dynamics, or budget efficiency.
Watch Out: A seemingly national campaign with strong local skew might indicate franchise-driven marketing or geo-specific targeting.
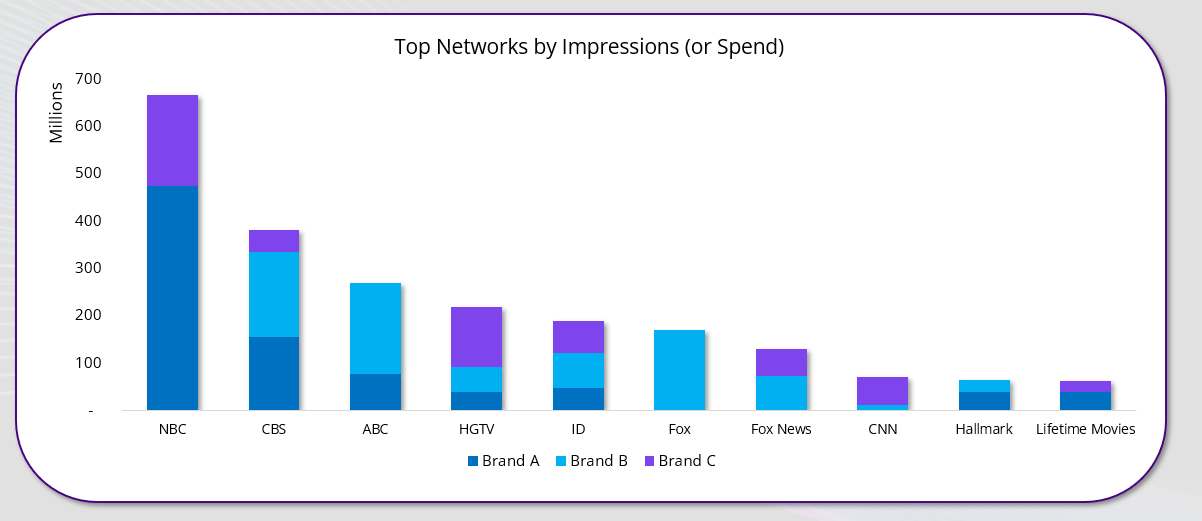
4. Identify Top Networks
Rank the networks or network groups (Disney, NBCU, Warner Bros Discovery) where each brand concentrates spend to reveal brand preferences and possible relationships.
What to Look For:
- Are they focused on one network group?
- Is the mix broad and seemingly scattered?
Why it matters: Concentration with certain publishers can indicate Upfront commitments, deeper brand integrations, or long-term partnerships.
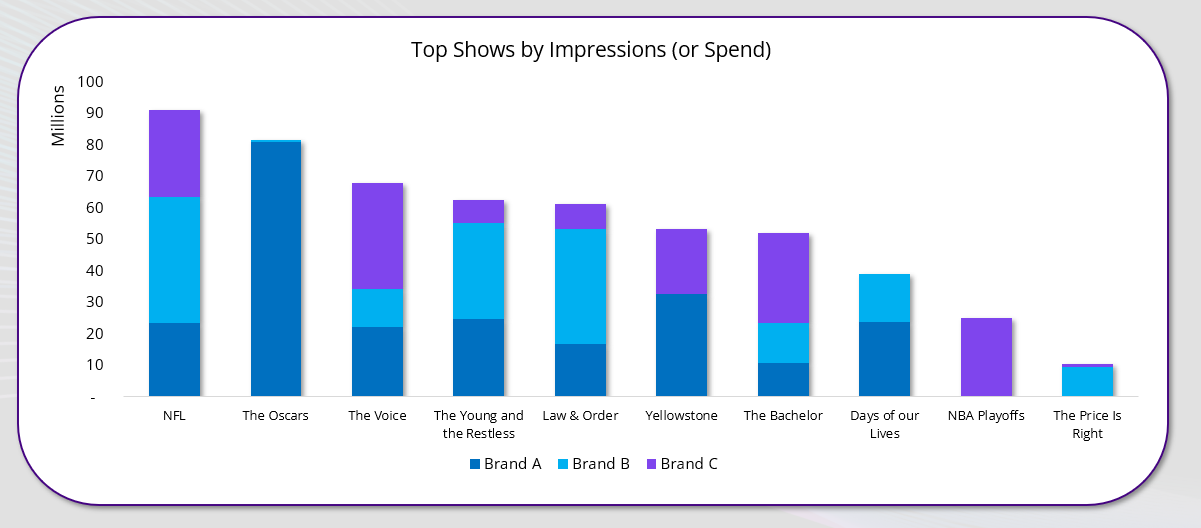
5. Spotlight Top Programs and Events
Identify which shows, events, or series drive the most impressions or spend to act as a proxy for target audience. Some key indicators include:
- Tentpole programming (NFL, award shows) = prestige & reach, cultural relevance
- Mix of programs for RON buys
What to Look For:
- Are they investing in high-reach live events (e.g., NFL, award shows)?
- Are they choosing prestige content or broad-reach run of network?
Why it matters: This tells you who the brand is trying to reach and whether they value premium content or broad reach.
6. Analyze Genre Share of Voice (SOV)
Group impressions by content genre such as sports, entertainment, news, kids, etc. for clues such as:
- Kids/family programming = household or co-view targeting
- Hispanic-focused networks = multicultural marketing efforts
What to Look For:
- Are brands investing in certain genres over others?
- Are there certain genres omitted from a brand’s media buy such as news?
Why it matters: Genre SOV gives insight into intended demographics and can surface trends in audience-first planning.
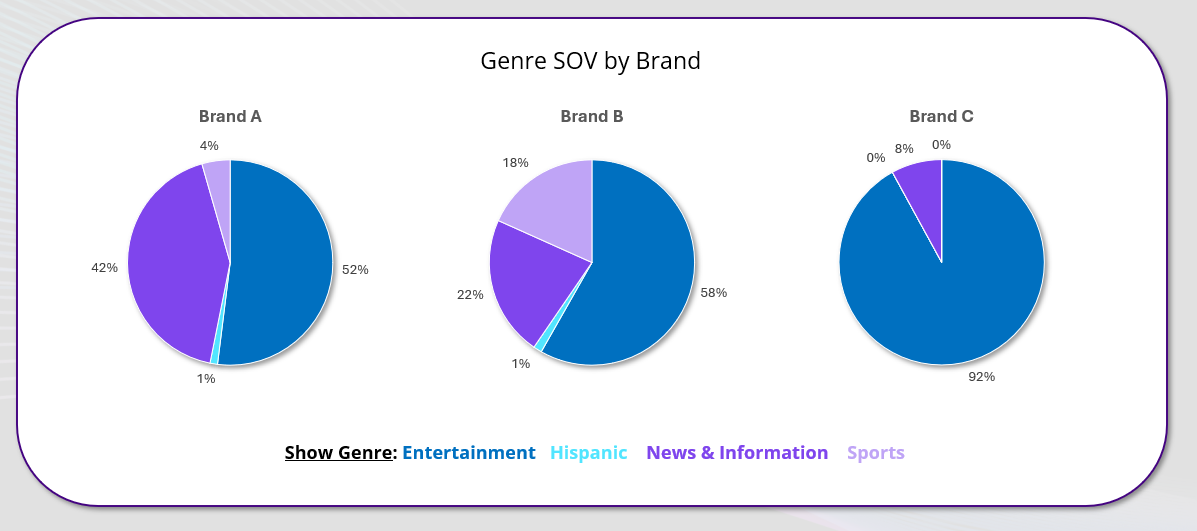
Pro Tip: Growing investment in multicultural programming is a strong indicator of future-forward audience strategy.
7. Understand Daypart Strategy
Dayparts define the time of day ads air and can impact pricing. As an example:
- Prime = Premium reach, awareness focus
- Daytime/Early Fringe = Cost efficient reach
- Overnight = Direct response or remnant buys
What to Look For:
- Are brands investing in certain high-profile dayparts like Prime?
- Is there an even mix of impressions across dayparts based on expectations?
Why it matters: Daypart mix indicates whether a brand is optimizing for cost, reach, or behavior. Gaps can signal whitespace for breakthrough.
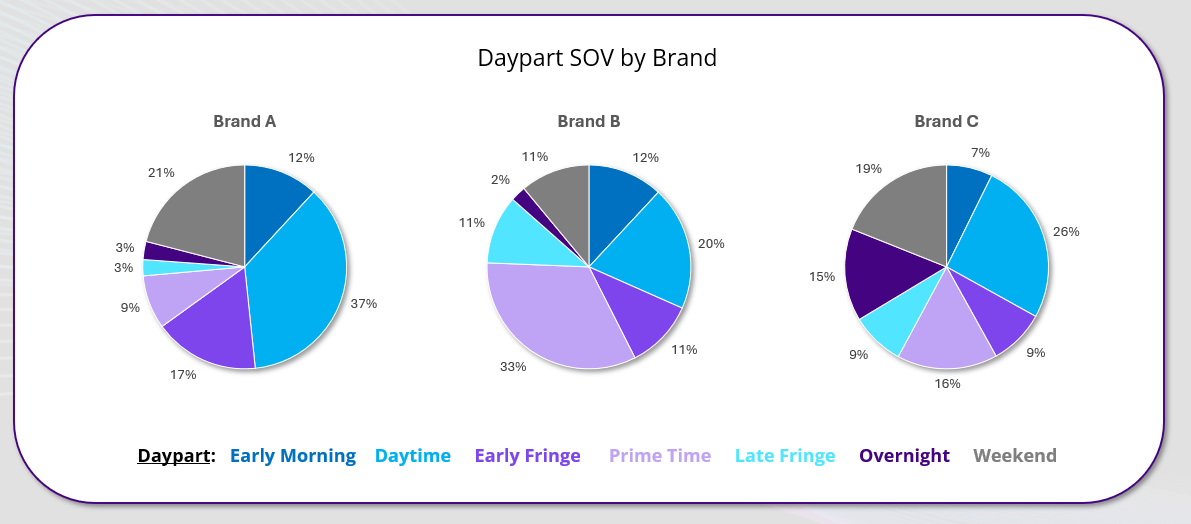
Whitespace Alert: Are competitors skipping mornings or late night? Could be an opportunity to own an underused daypart.
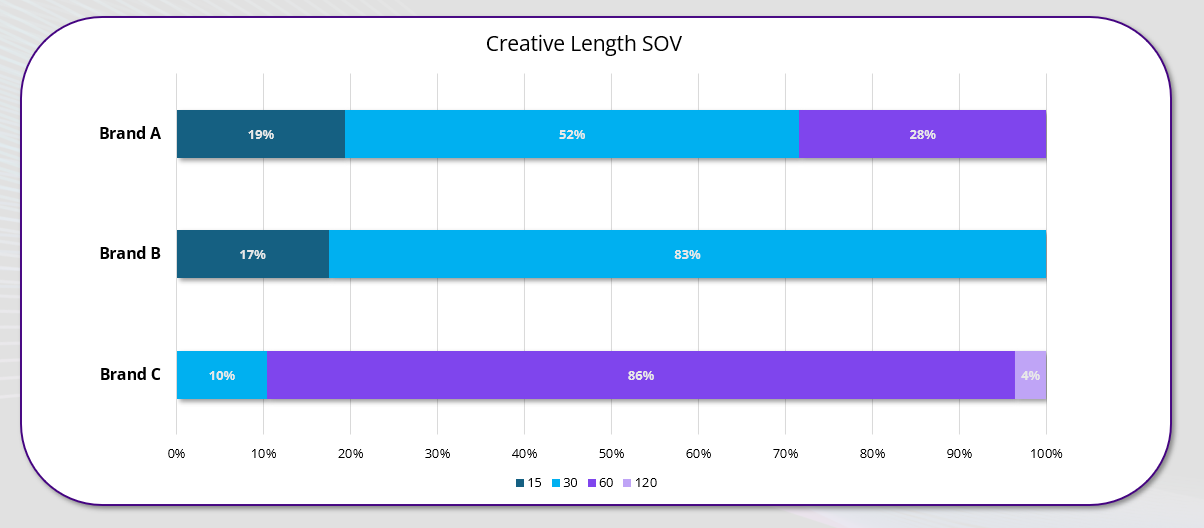
8. Review Creative Duration Breakouts
Examine the mix of creative lengths to indicate both potential budget allocations and messaging tactics:
- :30s = narrative-focused and versatile
- :15s = cost-effective, retargeting
- :60s+ = emotional storytelling, pharma, infomercial, or custom integrations
What to Look For:
- Is a brand primarily airing :30s creatives?
- Is there an even distribution across different creative lengths?
Why it matters: Duration mix often maps directly to campaign stage, from awareness with longer lengths to retargeting with shorter lengths.
Pro Tip: A campaign that launches with :30s then shifts to :15s is likely optimizing for awareness-to-conversion funnel sequencing.
9. Dig Into Pod Position
Where an ad appears in a commercial break (the pod) signals intent and budget:
- First position = highest visibility, most expensive
- Middle = lower cost, less breakthrough
- Last = recall opportunity before programming resumes
What to Look For:
- Is there a high concentration of impressions in the first or last POD?
- Is the majority of rotation in middle POD?
Why it matters: Pod placement can indicate a brand’s media priority and willingness to invest in attention.
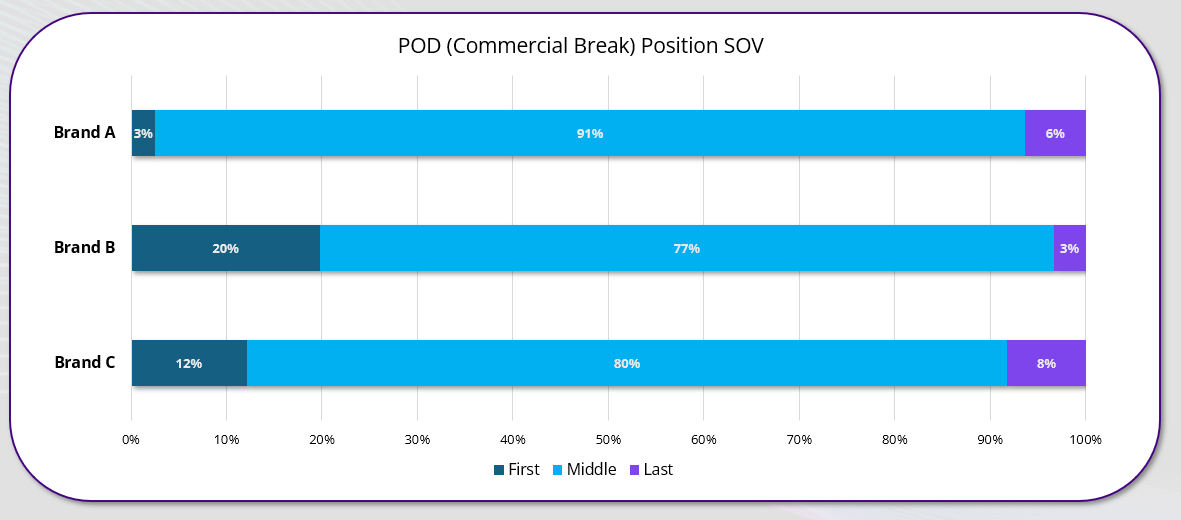
Pro-tip: High first-pod concentration may suggest a co-sponsorship or custom integration.
10. Audit Creative Messaging and Weight
A brand’s most-aired spots reflect business priorities and funnel strategy. Look beyond the metadata and study:
- Ads with the most impressions and spend associated with them indicate a priority for a brand
- The creatives themselves can indicate what type of audience they are targeting
What to Look For:
- Which ads run the most? Does it appear to be targeting a specific demo?
- Are they brand- or retail-focused? Any recurring themes (e.g., product launches, holiday pushes)?
Why it matters: Creative weight reveals funnel positioning and how aggressively a brand is pushing product vs. equity.
Bonus Layer: Add syndicated attention or outcome scores to evaluate creative performance beyond spend or impressions.
Don’t Skip CTV, Even If Data Is Limited
Competitive CTV measurement is still maturing, but there are increasing signals you can use to identify key insights. Similar to traditional TV, starting at a high-level then moving as granular as you can will signal:
- Campaign pacing for CTV buys
- Top publishers (Disney+/Hulu, Netflix, Roku, YouTube TV, etc.)
- Indicate open exchange programmatic (“other” bucket, longtail pubs) vs. direct publisher buys or PMP/PG deals
- Creative variation between linear and streaming
What to look for:
- Are creatives consistent across screens?
- Is activity skewed toward CTV or Linear TV?
Why it Matters: Monitoring a brand’s investment across CTV and Linear can identify shifts in strategies and how fast they are moving towards streaming.
It’s the Full Picture That Matters
Each of these dimensions — from pacing to daypart, genre to network, creative to platform — represents just one piece of the strategy puzzle. The true power comes from layering these insights together.
By reverse engineering how, where, and when your competitors show up — and what they’re saying when they do — you can identify:
- Underserved audiences or times of day (whitespace)
- Overexposed or overspent verticals
- Relationship clues between networks and brands
- Messaging arcs from awareness to conversion
Case Study: What Happened When Pepsi Skipped the Super Bowl
A classic example of what happens when a brand pulls back too hard: In 2010, Pepsi was the first in its industry to choose not to advertise during the Super Bowl, instead investing in digital-only activations through the Pepsi Refresh Project.
The result? Coke and Diet Coke gained market share as Pepsi’s visibility dropped to third place and saw sales decline by -6% after skipping one of the most watched TV events of the year.
The Lesson: While the Super Bowl is a unique case due to its cost and massive reach, it illustrates the risk of ignoring premium brand moments, particularly when competitors are front and center. One of the great advantages of CTV is the ability to combine the brand awareness building of TV with the precision of digital.
Sources:
Conclusion: See the Strategy Behind the Spend
Reverse engineering TV and CTV strategies helps uncover not just where money is going, but what your competitors believe will drive impact. If your team needs support turning media measurement into actionable insight, Three First Names & Associates is here to give you a competitive advantage.
At Three First Names & Associates, we bring a unique and forward-thinking approach to Connected TV by combining a deep expertise in TV advertising with a creative passion for the music industry. Founded by Nathan Michael Scott, our consulting firm leverages nearly a decade of experience in media and advertising to guide brands and agencies through the transition from traditional TV to streaming.